
Find data on how selected labor force characteristics change over time. Labor force and earnings data are presented by sex, age, race and Hispanic origin, and parental status when available.
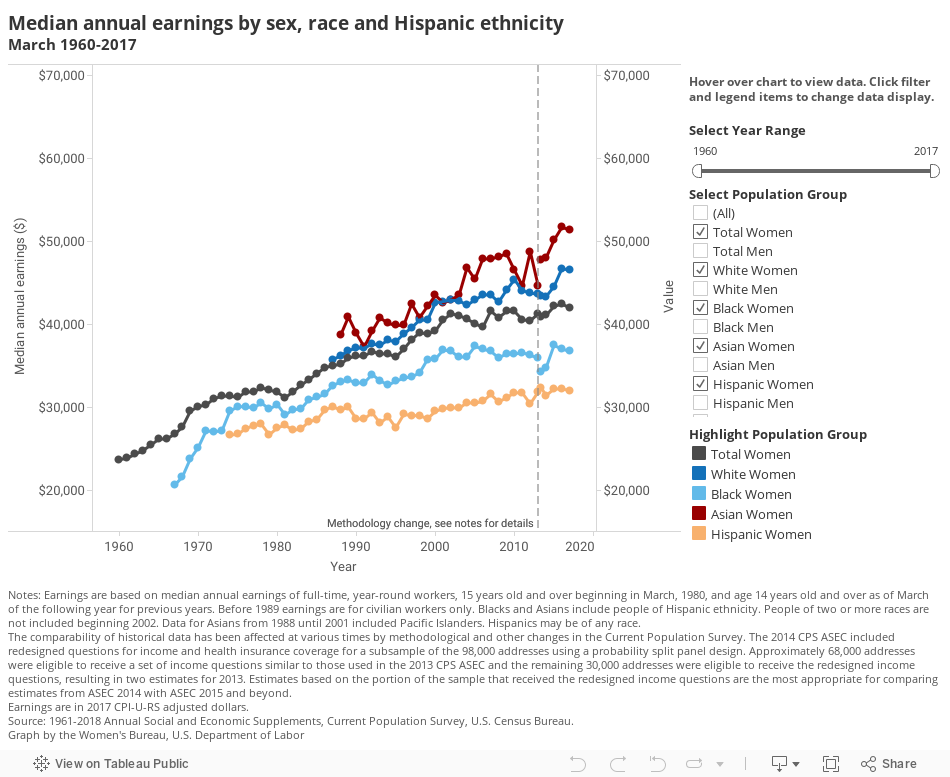
Median annual earnings by sex, race and Hispanic ethnicity
View text version of the Median annual earnings by sex, race and Hispanic ethnicity
| Year | All Women | All Men | White, non-Hispanic Women | White, non-Hispanic Men | Black Women | Black Men | Asian Women | Asian Men | Hispanic Women | Hispanic Men |
|---|---|---|---|---|---|---|---|---|---|---|
| 1960 | 23,657 | 38,991 | - | - | - | - | - | - | - | - |
| 1961 | 23,839 | 40,235 | - | - | - | - | - | - | - | - |
| 1962 | 24,295 | 40,970 | - | - | - | - | - | - | - | - |
| 1963 | 24,757 | 42,000 | - | - | - | - | - | - | - | - |
| 1964 | 25,422 | 42,980 | - | - | - | - | - | - | - | - |
| 1965 | 26,123 | 43,593 | - | - | - | - | - | - | - | - |
| 1966 | 26,186 | 45,497 | - | - | - | - | - | - | - | - |
| 1967 | 26,705 | 46,216 | - | - | 20,553 | 30,740 | - | - | - | - |
| 1968 | 27,598 | 47,456 | - | - | 21,592 | 32,905 | - | - | - | - |
| 1969 | 29,502 | 48,768 | - | - | 23,764 | 34,855 | - | - | - | - |
| 1970 | 30,072 | 50,653 | - | - | 25,123 | 35,976 | - | - | - | - |
| 1971 | 30,271 | 50,870 | - | - | 27,137 | 36,095 | - | - | - | - |
| 1972 | 31,019 | 53,609 | - | - | 27,046 | 38,365 | - | - | - | - |
| 1973 | 31,328 | 55,317 | - | - | 27,134 | 38,968 | - | - | - | - |
| 1974 | 31,335 | 53,332 | - | - | 29,505 | 39,193 | - | - | 26,637 | 39,944 |
| 1975 | 31,173 | 52,999 | - | - | 30,064 | 40,325 | - | - | 26,716 | 39,103 |
| 1976 | 31,814 | 52,854 | - | - | 30,051 | 39,722 | - | - | 27,411 | 40,331 |
| 1977 | 31,843 | 54,043 | - | - | 29,918 | 38,594 | - | - | 27,772 | 39,865 |
| 1978 | 32,331 | 54,392 | - | - | 30,502 | 42,684 | - | - | 27,922 | 40,578 |
| 1979 | 32,060 | 53,736 | - | - | 29,764 | 39,915 | - | - | 26,666 | 39,100 |
| 1980 | 31,803 | 52,863 | - | - | 30,312 | 38,477 | - | - | 27,491 | 38,509 |
| 1981 | 31,146 | 52,580 | - | - | 29,064 | 38,220 | - | - | 27,844 | 38,202 |
| 1982 | 31,851 | 51,585 | - | - | 29,693 | 37,943 | - | - | 27,196 | 37,647 |
| 1983 | 32,661 | 51,359 | - | - | 29,786 | 37,914 | - | - | 27,378 | 37,952 |
| 1984 | 33,306 | 52,320 | - | - | 30,917 | 37,488 | - | - | 28,269 | 38,173 |
| 1985 | 34,039 | 52,712 | - | - | 31,172 | 38,080 | - | - | 28,466 | 37,148 |
| 1986 | 34,755 | 54,077 | - | - | 31,548 | 39,267 | - | - | 29,625 | 36,004 |
| 1987 | 35,005 | 53,707 | 35,727 | 56,249 | 32,604 | 39,584 | - | - | 30,066 | 36,088 |
| 1988 | 35,173 | 53,253 | 36,188 | 56,451 | 33,039 | 40,697 | 38,653 | 54,182 | 29,657 | 35,662 |
| 1989 | 35,926 | 52,314 | 36,829 | 57,362 | 33,284 | 39,097 | 40,889 | 53,884 | 29,979 | 35,139 |
| 1990 | 36,158 | 50,489 | 37,134 | 54,967 | 32,908 | 38,515 | 38,898 | 48,823 | 28,588 | 34,907 |
| 1991 | 36,176 | 51,784 | 37,128 | 54,646 | 32,949 | 38,855 | 37,269 | 53,083 | 28,591 | 34,799 |
| 1992 | 36,710 | 51,861 | 37,601 | 54,478 | 33,943 | 38,465 | 39,159 | 52,419 | 29,344 | 33,560 |
| 1993 | 36,430 | 50,937 | 37,495 | 53,557 | 33,195 | 38,561 | 40,782 | 51,768 | 28,073 | 33,753 |
| 1994 | 36,436 | 50,629 | 38,063 | 53,558 | 32,671 | 38,958 | 40,124 | 52,609 | 28,829 | 33,333 |
| 1995 | 36,047 | 50,466 | 37,914 | 55,123 | 33,112 | 39,141 | 39,861 | 50,591 | 27,524 | 32,653 |
| 1996 | 37,005 | 50,169 | 38,847 | 55,316 | 33,514 | 41,210 | 39,885 | 53,771 | 29,131 | 32,863 |
| 1997 | 38,152 | 51,444 | 39,591 | 55,910 | 33,663 | 40,381 | 42,442 | 52,984 | 28,985 | 33,022 |
| 1998 | 38,982 | 53,276 | 40,515 | 56,878 | 34,137 | 40,773 | 40,801 | 52,496 | 28,972 | 33,590 |
| 1999 | 38,839 | 53,709 | 40,488 | 59,693 | 35,755 | 43,891 | 42,167 | 54,448 | 28,610 | 33,086 |
| 2000 | 39,200 | 53,175 | 42,591 | 58,879 | 35,813 | 42,967 | 43,501 | 57,891 | 29,490 | 33,942 |
| 2001 | 40,548 | 53,123 | 42,750 | 57,850 | 36,912 | 43,513 | 42,589 | 58,089 | 29,831 | 34,813 |
| 2002 | 41,269 | 53,875 | 42,907 | 58,041 | 36,731 | 42,928 | 42,950 | 57,224 | 29,938 | 35,486 |
| 2003 | 41,049 | 54,334 | 42,828 | 59,797 | 36,027 | 43,076 | 43,538 | 60,894 | 29,878 | 34,848 |
| 2004 | 40,640 | 53,072 | 42,313 | 59,244 | 36,079 | 40,703 | 46,832 | 59,832 | 30,539 | 34,677 |
| 2005 | 40,086 | 52,075 | 42,925 | 58,431 | 37,336 | 41,620 | 45,414 | 60,484 | 30,468 | 33,683 |
| 2006 | 39,628 | 51,506 | 43,552 | 59,013 | 36,992 | 42,377 | 47,914 | 62,691 | 30,711 | 35,419 |
| 2007 | 41,602 | 53,466 | 43,549 | 59,649 | 36,751 | 42,746 | 47,850 | 60,100 | 31,540 | 35,789 |
| 2008 | 40,797 | 52,920 | 42,673 | 58,486 | 35,939 | 42,583 | 48,181 | 58,597 | 30,640 | 35,333 |
| 2009 | 41,549 | 53,975 | 44,132 | 58,874 | 36,448 | 42,944 | 48,482 | 59,281 | 31,131 | 35,955 |
| 2010 | 41,562 | 54,027 | 45,392 | 58,544 | 36,396 | 41,513 | 46,515 | 58,268 | 31,753 | 35,579 |
| 2011 | 40,543 | 52,650 | 44,057 | 57,146 | 36,593 | 43,127 | 44,655 | 60,163 | 31,698 | 34,782 |
| 2012 | 40,422 | 52,838 | 43,761 | 56,193 | 36,244 | 41,197 | 48,760 | 62,803 | 30,403 | 34,488 |
| 2013 | 41,272 | 52,736 | 43,634 | 56,377 | 35,930 | 43,069 | 44,622 | 60,745 | 31,841 | 34,067 |
| 2013* | 40,888 | 52,717 | 43,463 | 58,123 | 34,207 | 41,251 | 47,789 | 60,418 | 32,319 | 33,818 |
| 2014 | 41,066 | 52,220 | 43,347 | 57,493 | 34,756 | 42,204 | 48,023 | 59,018 | 31,398 | 35,794 |
| 2015 | 42,155 | 52,988 | 44,556 | 59,188 | 37,459 | 42,530 | 50,152 | 64,136 | 32,188 | 36,910 |
| 2016 | 42,448 | 52,751 | 46,725 | 59,171 | 37,006 | 42,181 | 51,703 | 67,014 | 32,200 | 38,157 |
| 2017 | 41,977 | 52,146 | 46,513 | 60,388 | 36,735 | 42,076 | 51,378 | 67,673 | 32,002 | 38,876 |
Earnings are based on median annual earnings of full-time, year-round workers, 15 years old and over beginning in March, 1980, and age 14 years old and over as of March of the following year for previous years. Before 1989 earnings are for civilian workers only. Blacks and Asians include people of Hispanic ethnicity. People of two or more races are not included beginning 2002. Data for Asians from 1988 until 2001 included Pacific Islanders. Hispanics may be of any race. The comparability of historical data has been affected at various times by methodological and other changes in the Current Population Survey. The 2014 CPS ASEC included redesigned questions for income and health insurance coverage for a subsample of the 98,000 addresses using a probability split panel design. Approximately 68,000 addresses were eligible to receive a set of income questions similar to those used in the 2013 CPS ASEC and the remaining 30,000 addresses were eligible to receive the redesigned income questions, resulting in two estimates for 2013. Estimates based on the portion of the sample that received the redesigned income questions are the most appropriate for comparing estimates from ASEC 2014 with ASEC 2015 and beyond.
Earnings are in 2017 CPI-U-RS adjusted dollars.
Source: 1961-2018 Annual Social and Economic Supplements, Current Population Survey, U.S. Census Bureau.
Gender earnings ratio by race and Hispanic ethnicity

View text version of the Gender earnings ratio by race and Hispanic ethnicity
| Year | Total | White, non-Hispanic | Black | Asian | Hispanic |
|---|---|---|---|---|---|
| 1960 | 60.7 | - | - | - | - |
| 1961 | 59.2 | - | - | - | - |
| 1962 | 59.3 | - | - | - | - |
| 1963 | 58.9 | - | - | - | - |
| 1964 | 59.1 | - | - | - | - |
| 1965 | 59.9 | - | - | - | - |
| 1966 | 57.6 | - | - | - | - |
| 1967 | 57.8 | - | - | - | - |
| 1968 | 58.2 | - | 65.6 | - | - |
| 1969 | 58.9 | - | 68.2 | - | - |
| 1970 | 59.4 | - | 69.8 | - | - |
| 1971 | 59.5 | - | 75.2 | - | - |
| 1972 | 57.9 | - | 70.5 | - | - |
| 1973 | 56.6 | - | 69.6 | - | - |
| 1974 | 58.8 | - | 75.3 | - | 66.7 |
| 1975 | 58.8 | - | 74.6 | - | 68.3 |
| 1976 | 60.2 | - | 75.7 | - | 68.0 |
| 1977 | 58.9 | - | 77.5 | - | 69.7 |
| 1978 | 59.4 | - | 71.5 | - | 68.8 |
| 1979 | 59.7 | - | 74.6 | - | 68.2 |
| 1980 | 60.2 | - | 78.8 | - | 71.4 |
| 1981 | 59.2 | - | 76.0 | - | 72.9 |
| 1982 | 61.7 | - | 78.3 | - | 72.2 |
| 1983 | 63.6 | - | 78.6 | - | 72.1 |
| 1984 | 63.7 | - | 82.5 | - | 74.1 |
| 1985 | 64.6 | - | 81.9 | - | 76.6 |
| 1986 | 64.3 | - | 80.3 | - | 82.3 |
| 1987 | 65.2 | 63.5 | 82.4 | - | 83.3 |
| 1988 | 66.0 | 64.1 | 81.2 | 71.3 | 83.2 |
| 1989 | 68.7 | 64.2 | 85.1 | 75.9 | 85.3 |
| 1990 | 71.6 | 67.6 | 85.4 | 79.7 | 81.9 |
| 1991 | 69.9 | 67.9 | 84.8 | 70.2 | 82.2 |
| 1992 | 70.8 | 69.0 | 88.2 | 74.7 | 87.4 |
| 1993 | 71.5 | 70.0 | 86.1 | 78.8 | 83.2 |
| 1994 | 72.0 | 71.1 | 83.9 | 76.3 | 86.5 |
| 1995 | 71.4 | 68.8 | 84.6 | 78.8 | 84.3 |
| 1996 | 73.8 | 70.2 | 81.3 | 74.2 | 88.6 |
| 1997 | 74.2 | 70.8 | 83.4 | 80.1 | 87.8 |
| 1998 | 73.2 | 71.2 | 83.7 | 77.7 | 86.3 |
| 1999 | 72.3 | 67.8 | 81.5 | 77.4 | 86.5 |
| 2000 | 73.7 | 72.3 | 83.3 | 75.1 | 86.9 |
| 2001 | 76.3 | 73.9 | 84.8 | 73.3 | 85.7 |
| 2002 | 76.6 | 73.9 | 85.6 | 75.1 | 84.4 |
| 2003 | 75.5 | 71.6 | 83.6 | 71.5 | 85.7 |
| 2004 | 76.6 | 71.4 | 88.6 | 78.3 | 88.1 |
| 2005 | 77.0 | 73.5 | 89.7 | 75.1 | 90.5 |
| 2006 | 76.9 | 73.8 | 87.3 | 76.4 | 86.7 |
| 2007 | 77.8 | 73.0 | 86.0 | 79.6 | 88.1 |
| 2008 | 77.1 | 73.0 | 84.4 | 82.2 | 86.7 |
| 2009 | 77.0 | 75.0 | 84.9 | 81.8 | 86.6 |
| 2010 | 76.9 | 77.5 | 87.7 | 79.8 | 89.2 |
| 2011 | 77.0 | 77.1 | 84.8 | 74.2 | 91.1 |
| 2012 | 76.5 | 77.9 | 88.0 | 77.6 | 88.2 |
| 2013 | 78.3 | 77.4 | 83.4 | 73.5 | 93.5 |
| 2013* | 77.6 | 74.8 | 82.9 | 79.1 | 95.6 |
| 2014 | 78.6 | 75.4 | 82.4 | 81.4 | 87.7 |
| 2015 | 79.6 | 75.3 | 88.1 | 78.2 | 87.2 |
| 2016 | 80.5 | 79.0 | 87.7 | 77.2 | 84.4 |
| 2017 | 80.5 | 77.0 | 87.3 | 75.9 | 82.3 |
Earnings ratios are based on median annual earnings of full-time, year-round workers, 15 years old and over. Before 1989 earnings are for civilian workers only. Blacks and Asians include people of Hispanic ethnicity. People of two or more races are not included beginning 2002. Ratios for Asians from 1988 until 2001 included Pacific Islanders. Hispanics may be of any race.
The comparability of historical data has been affected at various times by methodological and other changes in the Current Population Survey. *The 2014 CPS ASEC included redesigned questions for income and health insurance coverage for a subsample of the 98,000 addresses using a probability split panel design. Approximately 68,000 addresses were eligible to receive a set of income questions similar to those used in the 2013 CPS ASEC and the remaining 30,000 addresses were eligible to receive the redesigned income questions, resulting in two estimates for 2013. Estimates based on the portion of the sample that received the redesigned income questions are the most appropriate for comparing estimates from ASEC 2014 with ASEC 2015 and beyond. Dash indicates data not available.
Source: 1961-2018 Annual Social and Economic Supplements, Current Population Survey, U.S. Census Bureau
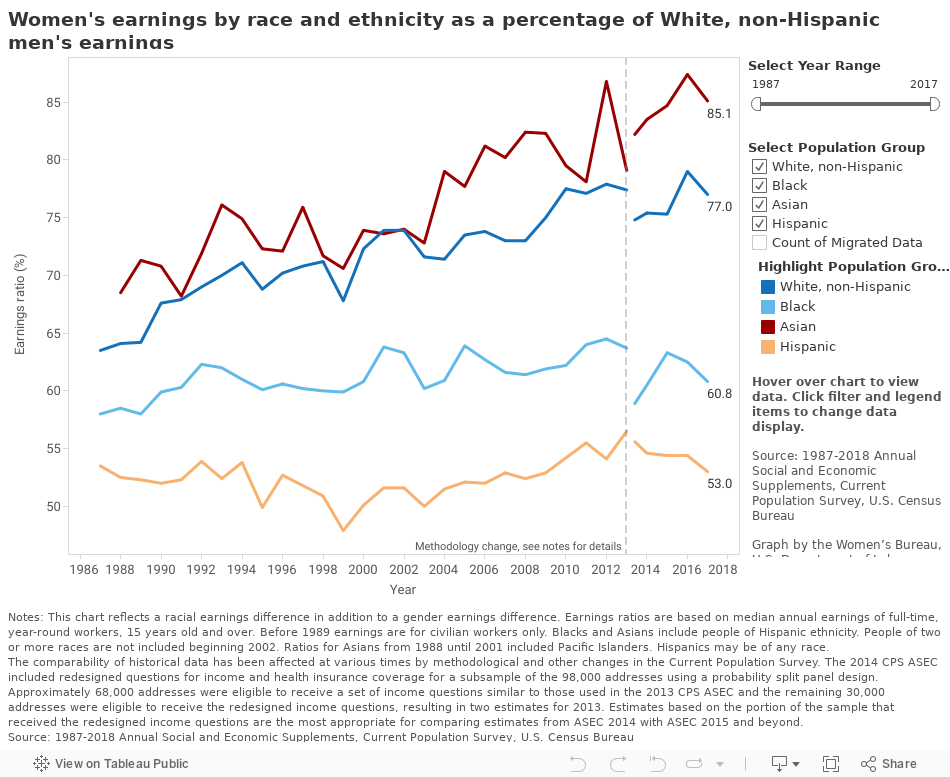
Women's earnings by race and ethnicity as a percentage of White, non-Hispanic men's earnings
| Year | White, non-Hispanic | Black | Asian | Hispanic |
|---|---|---|---|---|
| 1987 | 63.5 | 58.0 | - | 53.5 |
| 1988 | 64.1 | 58.5 | 68.5 | 52.5 |
| 1989 | 64.2 | 58.0 | 71.3 | 52.3 |
| 1990 | 67.6 | 59.9 | 70.8 | 52.0 |
| 1991 | 67.9 | 60.3 | 68.2 | 52.3 |
| 1992 | 69.0 | 62.3 | 71.9 | 53.9 |
| 1993 | 70.0 | 62.0 | 76.1 | 52.4 |
| 1994 | 71.1 | 61.0 | 74.9 | 53.8 |
| 1995 | 68.8 | 60.1 | 72.3 | 49.9 |
| 1996 | 70.2 | 60.6 | 72.1 | 52.7 |
| 1997 | 70.8 | 60.2 | 75.9 | 51.8 |
| 1998 | 71.2 | 60.0 | 71.7 | 50.9 |
| 1999 | 67.8 | 59.9 | 70.6 | 47.9 |
| 2000 | 72.3 | 60.8 | 73.9 | 50.1 |
| 2001 | 73.9 | 63.8 | 73.6 | 51.6 |
| 2002 | 73.9 | 63.3 | 74.0 | 51.6 |
| 2003 | 71.6 | 60.2 | 72.8 | 50.0 |
| 2004 | 71.4 | 60.9 | 79.0 | 51.5 |
| 2005 | 73.5 | 63.9 | 77.7 | 52.1 |
| 2006 | 73.8 | 62.7 | 81.2 | 52.0 |
| 2007 | 73.0 | 61.6 | 80.2 | 52.9 |
| 2008 | 73.0 | 61.4 | 82.4 | 52.4 |
| 2009 | 75.0 | 61.9 | 82.3 | 52.9 |
| 2010 | 77.5 | 62.2 | 79.5 | 54.2 |
| 2011 | 77.1 | 64.0 | 78.1 | 55.5 |
| 2012 | 77.9 | 64.5 | 86.8 | 54.1 |
| 2013 | 77.4 | 63.7 | 79.1 | 56.5 |
| 2013* | 74.8 | 58.9 | 82.2 | 55.6 |
| 2014 | 75.4 | 60.5 | 83.5 | 54.6 |
| 2015 | 75.3 | 63.3 | 84.7 | 54.4 |
| 2016 | 79.0 | 62.5 | 87.4 | 54.4 |
| 2017 | 77.0 | 60.8 | 85.1 | 53.0 |
These data reflect a race earnings gap in addition to a gender earnings gap. Earnings ratios are based on median annual earnings of full-time, year-round workers, 15 years old and over. Before 1989 earnings are for civilian workers only. Blacks and Asians include people of Hispanic ethnicity. People of two or more races are not included beginning 2002. Ratios for Asians from 1988 until 2001 included Pacific Islanders. Hispanics may be of any race.
The comparability of historical data has been affected at various times by methodological and other changes in the Current Population Survey. *The 2014 CPS ASEC included redesigned questions for income and health insurance coverage for a subsample of the 98,000 addresses using a probability split panel design. Approximately 68,000 addresses were eligible to receive a set of income questions similar to those used in the 2013 CPS ASEC and the remaining 30,000 addresses were eligible to receive the redesigned income questions, resulting in two estimates for 2013. Estimates based on the portion of the sample that received the redesigned income questions are the most appropriate for comparing estimates from ASEC 2014 with ASEC 2015 and beyond. Dash indicates data not available.
Source: 1987-2018 Annual Social and Economic Supplements, Current Population Survey, U.S. Census Bureau
Gender earnings ratio by weekly earnings

View text version of the Gender earnings ratio by weekly earnings
| Year | Earnings ratio |
|---|---|
| 1979 | 62.3 |
| 1980 | 64.2 |
| 1981 | 64.4 |
| 1982 | 65.7 |
| 1983 | 66.5 |
| 1984 | 67.6 |
| 1985 | 68.1 |
| 1986 | 69.5 |
| 1987 | 69.8 |
| 1988 | 70.2 |
| 1989 | 70.1 |
| 1990 | 71.9 |
| 1991 | 74.2 |
| 1992 | 75.8 |
| 1993 | 77.1 |
| 1994 | 76.4 |
| 1995 | 75.5 |
| 1996 | 75.0 |
| 1997 | 74.4 |
| 1998 | 76.3 |
| 1999 | 76.5 |
| 2000 | 76.9 |
| 2001 | 76.4 |
| 2002 | 77.9 |
| 2003 | 79.4 |
| 2004 | 80.4 |
| 2005 | 81.0 |
| 2006 | 80.8 |
| 2007 | 80.2 |
| 2008 | 79.9 |
| 2009 | 80.2 |
| 2010 | 81.2 |
| 2011 | 82.2 |
| 2012 | 80.9 |
| 2013 | 82.1 |
| 2014 | 82.5 |
| 2015 | 81.1 |
| 2016 | 81.9 |
| 2017 | 81.8 |
| 2018 | 81.1 |
Earnings ratios show female-to-male comparisons. The comparability of historical data has been affected at various times by methodological and other changes in the Current Population Survey. Ratios of median weekly earnings are based on full-time, wage and salary workers, 16 years old and over.
Source: 1979-2018 Current Population Survey, U.S. Bureau of Labor Statistics