
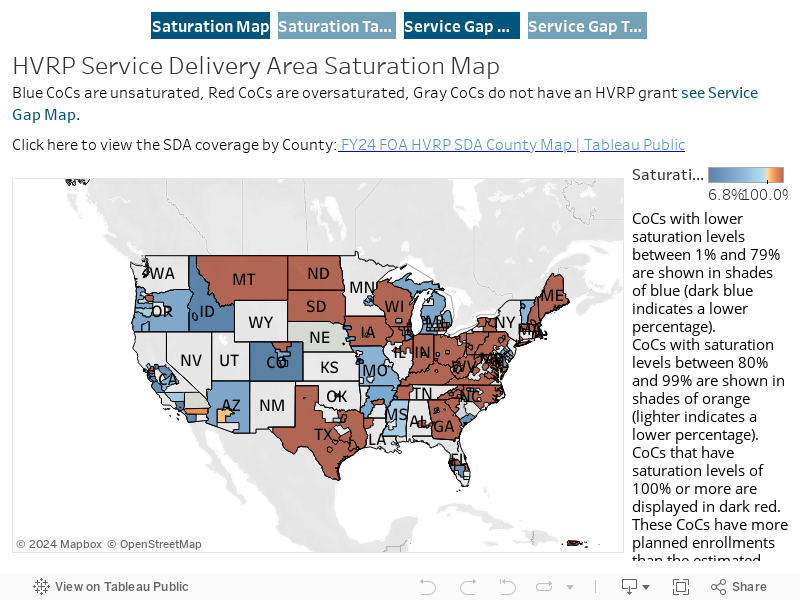
The Saturation Level Map
The Saturation Map represents every Department of Housing and Urban Development (HUD) Continuum of Care (CoC) served by HVRP grant recipients. Each CoC is represented by a color that indicates the saturation level, which is calculated by dividing the total number of HVRP grant recipients' annual planned enrollments in the CoC by the number of veterans experiencing homelessness (VEH) in the CoC from the HUD Point-in-Time (PIT) Count.
About the HVRP Funding Opportunity Announcement (FOA) 2024 SDA Saturation Map
Scope: Current HVRP grant recipients providing services in program year 2024 (July 1, 2024 - June 30, 2025).
About the HVRP Funding Opportunity Announcement (FOA) 2024 SDA Saturation Map
Download table version of Service Delivery Area Saturation Map (xlsx)
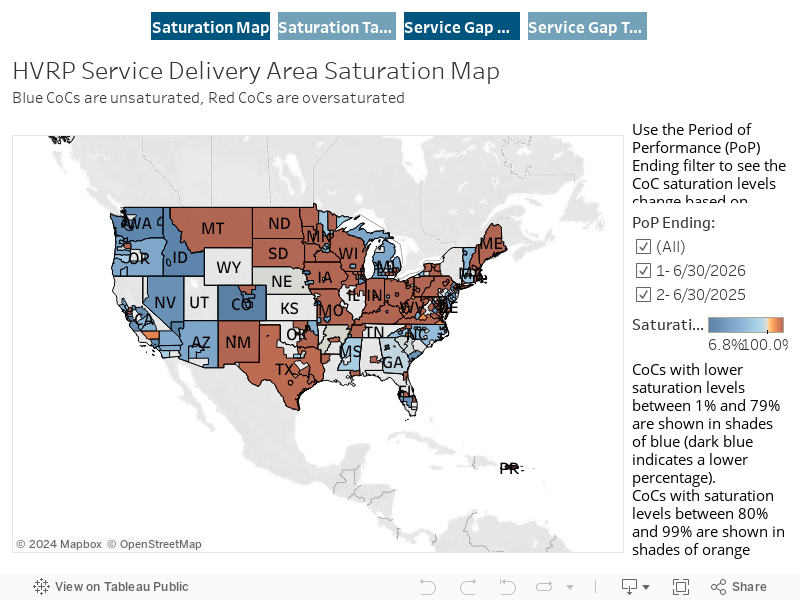
About the HVRP PY2023 SDA Saturation Map
Scope: All HVRP grants operating in program year 2023 (July 1, 2023 - June 30, 2024).
About the HVRP PY2023 SDA Saturation Map
Download table version of Service Delivery Area Saturation Map (xlsx)